|
Actuales
Las condiciones del clima son actualizadas en nuestra página cada 5
minutos y las Gráficas cada 15 min.
Históricas La información en
su totalidad es actualizada cada hora, en el transcurso del día. Las
Gráficas sobre los récord históricos se mantendrán en la página por
siete días. Los alti-bajos en el clima se mantienes en el mes y año
actuales.
Viento
/
Wind
 
Viento
El
anemómetro mide la velocidad y dirección del viento. La consola calcula
una velocidad promedio del viento en 10 minutos y una dirección
dominante del viento en 10 minutos.
Wind
The
anemometer measures wind speed and direction. The console calculates a
10-minute average wind speed and 10-minute dominant wind direction. The
last six 10-minute dominant wind directions are included in the compass
rose wind display.
Note:
The location of this station is a valley that forces surface wind
direction to be primarily from the Southwest or Northeast.
Temperatura
/
Temperature
  
Temperatura
El ISS
aloja el sensor de temperatura exterior en una envuelta blindada y con
venteo que reduce el error de temperatura inducido por radiación solar.
La consola
aloja el sensor de temperatura interior.
Temperature
The
ISS houses the outside temperature sensor in a vented and shielded
enclosure that minimizes the solar radiation induced temperature error.
The console houses the inside temperature sensor.
Temperaturas
aparentes /
Apparent Temperatures
  
Temperaturas aparentes
Vantage
Pro2 calcula tres lecturas de temperaturas aparentes:
·
Wind
Chill (Sensación térmica)
·
Heat
Index (Indice de calor)
·
Temperature/ Humidity/Sun/Wind (THSW) Index (Indice de
temperatura/humedad/sol/wind).
Las
temperaturas adicionales usan datos meteorológicos adicionales para
calcular lo que un cuerpo humano percibe es la temperatura en esas
condiciones.
·
Sensación térmica o Factor de enfriamiento por el viento
El Wind
Chill (factor de enfriamiento por el viento o sensación térmica) toma en
cuenta la manera en que la velocidad del viento afecta nuestra
percepción de la temperatura del aire. Nuestros cuerpos calientan las
moléculas del aire circundante al transferir el calor de la piel. Si no
hay movimiento de aire, esta capa aislante de moléculas de aire caliente
permanece cerca del cuerpo y lo protege un poco de las moléculas de aire
más frío. Sin embargo, el viento se lleva ese aire caliente que rodea el
cuerpo. Cuanto más fuerte sopla el viento, más rápido se lleva el calor
y más frío se siente. A temperaturas más altas el viento tiene un efecto
calentador.
·
Índice
de calor
El Heat
Index (Indice de calor) usa la temperatura y la humedad relativa para
determinar cuan caliente realmente se siente el aire. Cuando la humedad
es baja, la temperatura aparente será más baja que la temperatura del
aire, dado que la transpiración se evapora rápidamente para enfriar el
cuerpo. Sin embargo, cuando la humedad es alta (por ej., el aire está
más saturado de vapor de agua) la temperatura aparente se siente más
alta que la temperatura real del aire, porque la transpiración se
evapora más lentamente.
·
THSW
(Indice de temperatura/humedad/sol/viento)
El
índice THSW (temperatura/humedad/sol/viento) usa la humedad y la
temperatura igual que el índice de calor, pero también incluye los
efectos de calentamiento del sol y los efectos de enfriamiento del
viento (como wind chill) para calcular una temperatura aparente de lo
que sentiría expuesto al sol.
Apparent Temperatures
Vantage Pro2 calculates three apparent temperature readings:
o
Wind Chill
o
Heat Index
o
Temperature/Humidity/Sun/Wind (THSW) Index.
Apparent temperatures use additional weather data to calculate what a
human body perceives the temperature to be in those conditions.
o
Wind chill
Wind chill takes into account how the speed of the wind affects our
perception of the air temperature. Our bodies warm the surrounding air
molecules by
transferring heat from the skin. If there’s no air movement, this
insulating layer of warm air molecules stays next to the body and offers
some protection
from cooler air molecules. However, wind sweeps that warm air
surrounding the body away. The faster the wind blows, the faster heat is
carried away and the colder you feel. Wind has a warming effect at
higher temperatures.
o
Heat Index
The
Heat Index uses temperature and the relative humidity to determine how
hot the air actually “feels.” When humidity is low, the apparent
temperature
will be lower than the air temperature, since perspiration evaporates
rapidly to cool the body. However, when humidity is high (i.e.,
the air is more saturated with water vapor) the apparent temperature
“feels” higher than the actual air temperature, because perspiration
evaporates more slowly.
o
THSW (Temperature/Humidity/Sun/Wind ) Index
The
THSW Index uses humidity and temperature like for the Heat Index, but
also includes the heating effects of sunshine and the cooling effects of
wind
(like
wind chill) to calculate an apparent temperature of what it “feels” like
out in the sun.
Humedad /
Humidity
 
Humedad
La
humedad misma simplemente se refiere a la cantidad de vapor de agua en
el aire. Sin embargo, la cantidad total de vapor de agua que el aire
puede contener varía con la temperatura y presión del aire. La humedad
relativa toma en cuenta estos factores y ofrece una lectura de humedad
que refleja la cantidad de vapor de agua en el aire como un porcentaje
de la cantidad que el aire es capaz de retener. Por lo tanto, la
humedad
relativa realmente no es una medida de la cantidad de vapor de agua en
el aire, sino una relación entre el contenido de vapor de aguaaire y su
capacidad. Cuando usamos el término humedad en el manual y en la
pantalla, queremos decir humedad relativa.
Es
importante comprender que la humedad relativa cambia con la temperatura,
la presión y el contenido de vapor de agua. Para una porción de aire con
una capacidad de 10 g de vapor de agua que contiene 4 g de vapor de
agua, la humedad relativa sería 40%. La adición de 2 g más de vapor de
agua (para un total de 6 g) cambiaría la humedad a 60%. Si después esa
misma porción de aire se calentara de tal modo que tuviera una capacidad
de 20 g de vapor de agua, la humedad relativa bajaría a 30% aunque el
contenido de vapor de agua no cambiaría.
La
humedad relativa es un factor importante en la determinación de la
cantidad de evaporación de las plantas y superficies mojadas, dado que
el aire caliente con la humedad relativa tiene una gran capacidad para
absorber vapor de agua adicional.
Humidity
Humidity itself simply refers to the amount of water vapor in the air.
However, the total amount of water vapor that the air can contain varies
with air temperature and pressure. Relative humidity takes into account
these factors and offers a humidity reading which reflects the amount of
water vapor in the air as a percentage of the amount the air is capable
of holding. Relative humidity, therefore, is not actually a measure of
the amount of water vapor in the air, but a ratio of the air’s water
vapor content to its capacity. When we use the term humidity in the
manual and on the screen, we mean relative humidity.
It
is important to realize that relative humidity changes with temperature,
pressure, and water vapor content. A parcel of air with a capacity for
10 g of water vapor which contains 4 g of water vapor, the relative
humidity would be 40%. Adding 2 g more water vapor (for a total of 6 g)
would change the humidity to 60%. If that same parcel of air is then
warmed so that it has a capacity for 20 g of water vapor, the relative
humidity drops to 30% even though water vapor content does not change.
Relative humidity is an important factor in determining the amount of
evaporation from plants and wet surfaces since warm air with low
humidity has a large capacity to absorb extra water vapor.
Punto de rocío /
Dew Point

Punto de rocío
El punto
de rocío es la temperatura a la que el aire debe enfriarse para que
ocurra la saturación (100% de humedad relativa), siempre que no haya
ningún cambio en el contenido de vapor de agua. El punto de rocío es una
medida importante usada para pronosticar la formación de rocío, escarcha
y neblina. Si el punto de
rocío y
la temperatura están muy cerca al atardecer cuando el aire comienza a
enfriarse, es muy probable
que haya
niebla durante la noche. El punto de rocío también es una buena
indicación del contenido de vapor de agua real del aire, a diferencia de
la humedad relativa, la cual toma en cuenta la temperatura del aire. Un
punto alto de rocío indica un contenido de vapor de agua alto; un punto
de rocío bajo indica un contenido de vapor de agua bajo. Además, un
punto de rocío alto indica una mejor posibilidad de lluvia, tormentas
severas y tornados.
También
se puede usar el punto de rocío para pronosticar la temperatura mínima
durante la noche. Siempre
que no
se anticipe ningún frente nuevo durante la noche y la humedad relativa
vespertina sea mayor que o
igual a
50%, el punto de rocío vespertino nos dará una buena idea de qué
temperatura mínima esperar
durante
la noche, ya que el aire nunca puede ponerse más frío que el punto de
rocío.
Dew Point
Dew
point is the temperature to which air must be cooled for saturation
(100% relative humidity) to occur, providing there is no change in water
vapor content. The dew point is an important measurement used to
predict the formation of dew, frost, and fog. If dew point and
temperature are close together in the late afternoon when the air begins
to turn colder, fog is likely during the night. Dew point is also a good
indicator of the air’s actual water vapor content, unlike relative
humidity, which takes the air’s temperature into account. High dew
point indicates high water vapor content; low dew point indicates low
water vapor content. In addition a high dew point indicates a better
chance of rain, severe thunderstorms, and tornados.
You
can also use dew point to predict the minimum overnight temperature.
Provided no new fronts are expected overnight and the afternoon relative
humidity is greater than or equal to 50%, the afternoon’s dew point
gives you an idea of what minimum temperature to expect overnight, since
the air can never get colder than the dew point.
Lluvia
/
Rain
    
Lluvia
El
Vantage Pro2 incorpora un colector de lluvia tipo recipiente volcable
que mide 0.2 mm de lluvia por cada vuelco del recipiente. Cuatro
variables separadas llevan la cuenta de los totales de lluvia:
·
Tormenta
lluviosa (“Storm Rain”)
·
lluvia
diaria (“Day Rain”)
·
lluvia
mensual (“Month Rain”)
·
lluvia
annual (“Year Rain”)
·
Razón de
lluvia (“Rain Rate”)
Los
cálculos de pluviometría están basados en el intervalo de tiempo entre
cada vuelco del recipiente, el cual es cada incremento de caída de
lluvia de 0.2 mm.
Rain
Vantage Pro2 incorporates a tipping-bucket rain collector in the ISS
that measures 0.2 mm for each tip of the bucket. Four separate variables
track rain totals:
·
“rain storm”
·
“daily rain”
·
“monthly rain,”
·
“yearly rain.”
Rain rate calculations are based on the interval of time between each
bucket tip, which is each .2 mm rainfall increment.
Presión
barométrica /
Barometric Pressure
 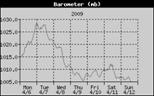
Presión barométrica
El peso
del aire que forma nuestra atmósfera ejerce una presión sobre la
superficie de la tierra. Esta presión es conocida como presión
atmosférica. Generalmente, cuanto más aire hay sobre una zona, más alta
la presión atmosférica, esto significa que la presión atmosférica cambia
con la altitud.
Por
ejemplo, la presión atmosférica es mayor a nivel del mar que en la cima
de una montaña. Para compensar esta diferencia y facilitar la
comparación
entre
lugares con distintas altitudes, la presión atmosférica generalmente se
ajusta a la presión equivalente a nivel del mar. Esta presión es
conocida como presión barométrica.
La
presión barométrica también cambia con las condiciones climáticas
locales, lo que la convierte en una herramienta para pronosticar el
tiempo extremadamente importante y útil. Las zonas de alta presión
generalmente son asociadas con buen tiempo, mientras que las de baja
presión son asociadas con mal tiempo. Sin embargo, para fines de
pronóstico, generalmente el valor absoluto de presión barométrica es
menos importante que el cambio en
la
misma. En general, un aumento de presión indica un mejoramiento de las
condiciones climáticas, mientras que una caída de presión indica
deterioro
de las mismas.
Barometric Pressure
The
weight of the air that makes up our atmosphere exerts a pressure on the
surface of the earth. This pressure is known as atmospheric pressure.
Generally, the more air above an area, the higher the atmospheric
pressure, this means that atmospheric pressure changes with altitude.
For example, atmospheric pressure is greater at sea level than on a
mountaintop. To compensate
for
this difference and facilitate comparison between locations with
different altitudes, atmospheric pressure is generally adjusted to the
equivalent sea level pressure.
Barometric pressure also changes with local weather conditions, making
barometric pressure an extremely important and useful weather
forecasting tool. High pressure zones are generally associated with
fair weather while low pressure
zones are generally associated with poor weather. For forecasting
purposes, however, the absolute barometric pressure value is generally
less important than the change in barometric pressure. In general,
rising pressure indicates improving weather conditions while falling
pressure indicates deteriorating weather conditions.
Radiación solar
/
Solar Radiation

Radiación solar
Lo que
llamamos "radiación solar actual" es técnicamente conocido como
Radiación solar global, una medida de la intensidad de la radiación del
sol que llega a una superficie horizontal. Esta irradiación incluye
tanto el componente directo del sol como el componente reflejado del
resto del cielo. La lectura de radiación solar da una medida de la
cantidad de radiación solar que choca contra el sensor de radiación
solar en cualquier momento dado, expresada en watts/metro cuadrado (W/m²).
Solar Radiation
What we call “current solar radiation” is technically known as Global
Solar Radiation, a measure of the intensity of the sun’s radiation
reaching a horizontal surface. This irradiance includes both the direct
component from the sun and the reflected component from the rest of the
sky. The solar radiation reading gives a measure of the amount of solar
radiation hitting the solar radiation sensor at any given time,
expressed in Watts/sq. meter (W/m2).
Radiación
ultravioleta (UV) /
UV (Ultra Violet) Radiation
Radiación ultravioleta (UV)
La
energía del sol llega a la tierra como rayos visibles, infrarrojos y
ultravioleta (UV). La exposición a los rayos UV puede causar
numerosos problemas de salud, tal como quemadura del sol, cáncer de
la piel, envejecimiento de la piel, cataratas, y puede suprimir el
sistema inmune. La Vantage Pro2 ayuda a analizar los niveles
cambiantes de radiación UV y puede advertir sobre situaciones donde
la exposición es extremadamente peligroso. La radiación UV requiere
el sensor de radiación UV La Vantage Pro2 presenta las lecturas de
UV en dos escalas: MEDs e índice UV.
Nota: Las lecturas UV de su estación no toman en
cuenta los rayos UV reflejados de la nieve, rena o agua, los que puede
aumentar significativamente su exposición. Ni tampoco toman en cuenta
los peligros de la exposición prolongada a los rayos UV.
Las lecturas no sugieren que ninguna cantidad de
exposición es segura o saludable. No use la Vantage Pro2 para determinar
la cantidad de radiación UV a la cual usted está expuesto. La
evidencia científica sugiere que la exposición a
radiación UV debe evitarse y que incluso una dosis baja de UV puede ser
nociva.
____________________________________________________________________________________________________
MED
de UV
MED
(dosis eritematógena mínima) se define como la cantidad de exposición a
la luz solar necesaria para inducir una rojez apenas perceptible de la
piel dentro de 24 horas de ocurrida la exposición al sol. En otras
palabras, la exposición a 1 MED dará por resultado una rojez de la
piel. Debido a que distintos tipos de pie se queman a distintas
velocidades, 1 MED para las personas con piel muy oscura es diferente a
1 MED para las personas con piel muy blanca.
Tanto la
Agencia para la Protección Ambiental de EE.UU. (EPA) como la Environment
Canada han desarrollado categorías de tipo de piel correlacionando las
características de la piel con las velocidades de quemadura de sol.
FOTOTIPOS
DE
PIEL
SEGUN
LA
EPA
(U.S.
Environmental Protection Agency)
|
Fototipo de piel |
Color de piel |
Historia de bronceado y quemadura de sol |
|
1 -Nunca se broncea, siempre se quema
|
Blanco pálido o lechoso; alabastro
|
Desarrolla quemadura de sol roja; hinchazón dolorosa, la piel se
desprende
|
|
2 - Algunas veces se broncea,
usualmente se quema |
Moreno muy claro; algunas veces con
pecas |
Usualmente se quema, aparece color rosado o rojo; puede
desarrollar gradualmente un ligero bronceado
|
|
3 - Usualmente se broncea, algunas
veces se quema
|
Bronceado ligero; moreno u oliva;
definidamente pigmentado |
Raramente se quema; muestra un bronceado
moderadamente rápido |
|
4 - Siempre se broncea; raramente
se quema |
Moreno, moreno oscuro o negro
|
Raramente se quema; muestra un bronceado muy rápido |
ENVIRONMENT
CANADA
: TIPOS
DE
PIEL
Y
REACCUPIB
AL
SOL
SEGUN
ENVIRONMENT
CANADA
|
Fototipo de piel |
Color de piel |
Historia de bronceado y quemadura de sol |
|
I |
Blanco |
Siempre se quema fácilmente, nunca se broncea |
|
II |
Blanco |
Siempre se quema fácilmente, se broncea muy poco |
|
III |
Moreno claro |
Se quema moderadamente, se broncea gradualmente |
|
IV |
Moreno moderado |
Se quema muy poco, se broncea bien |
|
V |
Moreno oscuro |
Raramente se quema, se broncea profusamente |
|
VI |
Negro |
Nunca se quema, pigmentación profunda |
a
Desarrollado por T. B. Fitzpatrick de Harvard Medical School. Más
información acerca de los Tipos de piel Fitzpatrick está disponible en:
Fitzpatrick TB. Editorial: the validity and practicality of sun-reactive
skin types I through V. (la validez y practicabilidad de los tipos de
piel sensible al sol I al VI). Arch Dermatol 1988; 124:869-871
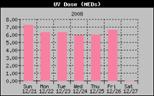
|
Missing Graph to be inserted at a later date |
UV Dose and Sunburn - Use this plot to estimate the MED dose leading to
sunburn. A person with
Type II (Environment Canada) skin type might choose 0.75 MED as the
maximum for the day; in
contrast, a person with Type V (Environment Canada) Skin Type might
consider 2.5 MEDs a reasonable
dose for the day. NOTE: the Vantage Pro2 assumes a Fitzpatrick (Environment
Canada) Skin Type of II.
UV (Ultra Violet) Radiation
Energy from the sun reaches the earth as visible, infrared, and
ultraviolet (UV) rays. Exposure to UV rays can cause numerous
health problems, such as sunburn, skin cancer, skin aging, cataracts,
and can suppress the immune system. The Vantage Pro2 helps analyze
the changing levels of UV radiation and can advise of situations
where exposure is particularly unacceptable. UV radiation requires
the UV radiation sensor. The Vantage Pro2 displays UV readings in
two scales: MEDs and UV Index.
Note: Your station’s UV readings do not take into account UV
reflected off snow, sand, or water, which can significantly increase
your exposure. Nor do your UV readings take into account the dangers of
prolonged UV exposure. The readings do not suggest that any amount of
exposure is safe or healthful. Do not use the Vantage Pro2 to determine
the amount of UV radiation to which you expose yourself. Scientific
evidence suggests that UV exposure should be avoided and that even low
UV doses can be harmful.
UV MEDs
MED
(Minimum Erythemal Dose) is defined as the amount of sunlight exposure
necessary to induce a barely perceptible redness of the skin within 24
hours after sun exposure. In other words, exposure to 1 MED will result
in a reddening of the skin. Because different skin types burn at
different rates, 1 MED for persons with very dark skin is different from
1 MED for persons
with very light skin.
Both the U.S. Environmental Protection Agency (EPA) and Environment
Canada have developed skin type categories correlating characteristics
of skin with rates of sunburn.
EPA SKIN PHOTOTYPES
(U.S. Environmental Protection
Agency)
|
Skin Phototype |
Skin color |
Tanning & Sunburn history |
|
1 - Never tans, always burns.
|
Pale or milky white; alabaster
|
Develops red sunburn; painful swelling, skin peels. |
|
2 - Sometimes tans, usually burns |
Very light brown; sometimes freckles
|
Usually burns, pinkish or red coloring appears;
can gradually develop light brown tan.
|
|
3 - Usually tans, sometimes burns
|
Light tan; brown, or olive; distinctly pigmented |
Rarely burns; shows moderately rapid tanning
response
|
|
4 - Always tans; rarely burns
|
Brown, dark brown, or black
|
Rarely burns; shows very rapid tanning response |
ENVIRONMENT
CANADA
SKIN TYPES
AND
REACTION
TO THE
SUN
|
Skin Type |
Skin Color |
History of Tanning & Sunburning |
|
I |
White |
Always burns easily, never tans |
|
II |
White |
Burns moderately, tans gradually
|
|
III |
Light Brown |
Burns rarely, tans profusely
|
|
IV |
Moderate Brown |
Burns minimally, tans well
|
|
V |
Dark Brown |
Burns rarely, tans profusely
|
|
VI |
Black |
Never burns, deep pigmentation
|
Developed by T. B. Fitzpatrick of the Harvard Medical School. More about
the Fitzpatrick Skin Types is available in: Fitzpatrick TB. Editorial:
the validity and practicality of sun-reactive skin types I through VI.
Arch Dermatol 1988; 124:869-871
|
Missing Graph to be inserted at a later date |
UV Dose and Sunburn - Use this plot to estimate the MED dose leading to
sunburn. A person with
Type II (Environment Canada) skin type might choose 0.75 MED as the
maximum for the day; in
contrast, a person with Type V (Environment Canada) Skin Type might
consider 2.5 MEDs a reasonable
dose for the day. NOTE: the Vantage Pro2 assumes a Fitzpatrick (Environment
Canada) Skin Type of II.
Índice
UV /
UV
Index
Índice UV
La
Vantage Pro2 también puede visualizar el índice UV, una medida de
intensidad definida primero por
Environment Canada y desde entonces adoptada por la Organización
Meteorológica Mundial. El índice de
UV
asigna un número entre 0 y 16 a la intensidad de UV actual. La EPA de
EE.UU. categoriza los valores del índice como se muestran en la tabla
siguiente. Cuanto más bajo el número, más bajo el peligro de quemadura
de sol. El valor de índice publicado por el Servicio Meteorológico
Nacional de EE.UU. es un pronóstico de la intensidad de UV al mediodía
del día siguiente. Los valores de índice visualizados por la Vantage
Pro2 son mediciones en tiempo real.
|
Valores de índice |
Categorías de exposición |
|
0-2 |
Baja |
|
3-4 |
Moderada |
|
5-6 |
Alta |
|
7-8 |
Muy alta |
|
10+ |
Extrema |
UV Index
Vantage Pro2 can also display UV Index, an intensity measurement first
defined by Environment Canada and since been adopted by the World
Meteorological Organization. UV Index assigns a number between 0 and 16
to the current UV intensity. The US EPA categorizes the Index values as
shown in table A-3. The lower the number, the lower the danger of
sunburn. The Index value published by the U.S. National Weather Service
is a forecast of the next day’s noontime UV intensity. The index values
displayed by the Vantage Pro2 are real-time measurements.
|
Index Values |
Exposure Category |
|
0-2 |
Low |
|
3-4 |
Moderate |
|
5-6 |
High |
|
7-8 |
Very High |
|
10+ |
Extreme |
Evapotranspiración (ET) /
Evapotranspiration (ET)

Evapotranspiración (ET)
La
evapotranspiración (ET) es una medición de la cantidad de vapor de agua
devuelta al aire en una zona
dada.
Combina la cantidad de vapor de agua devuelta mediante evaporación (de
las superficies mojadas)
con la
cantidad de vapor de agua devuelta mediante transpiración (exhalación de
humedad a través de
los
estomas de las plantas) para llegar a un total. Efectivamente, la ET es
lo contrario a lluvia, y se expresa en las mismas unidades de medida
(pulgadas, milímetros).
La
Vantage Pro2 usa la temperatura del aire, la humedad relativa, la
velocidad media del viento y los datos de radiación solar para calcular
la ET, lo cual se hace una vez por hora en la hora.
Evapotranspiration (ET)
Evapotranspiration (ET) is a measurement of the amount of water vapor
returned to the air in a given area. It combines the mount of water
vapor returned through evaporation (from wet surfaces) with the amount
of water vapor returned through transpiration (exhaling of moisture
through plant stomata) to arrive at a total. Effectively, ET is the
opposite of rainfall, and it is
expressed in the same units of measure (inches, millimeters).
The
Vantage Pro2 uses air temperature, relative humidity, average wind speed,
and solar radiation data to estimate ET, which is calculated once an
hour on the hour.
Humedad
de las hojas /
Leaf Wetness

Humedad de las hojas
La
humedad de las hojas proporciona una indicación si la superficie del
follaje en la zona está mojada o seca al indicar cuan mojada está la
superficie del sensor. La lectura de la humedad de las hojas varía de 0
(seco) hasta 15.
Leaf Wetness
Leaf wetness provides an indication of whether the surface of foliage in
the area is wet or dry by indicating how wet the surface of the sensor
is. The leaf wetness reading ranges from 0 (dry) to 15.
Humedad
del suelo /
Soil Moisture

Humedad del suelo
La
humedad del suelo, tal como el nombre lo indica, es una medida del
contenido de humedad del suelo. La humedad del suelo se mide en una
escala de 0 a 200 centibares, y puede ayudar a escoger las horas para
regar
las
cosechas. El sensor de humedad del suelo mide el vacío creado en el
suelo por la falta de humedad. Una lectura alta de humedad indica un
suelo más seco; una lectura de humedad más baja significa un suelo más
mojado.
Soil Moisture
Soil Moisture, as the name suggests, is a measure of the moisture
content of the soil. Soil moisture is measured on a scale of 0 to 200
centibars, and can help choose times to water crops. The soil moisture
sensor measures the vacuum created in the soil by the lack of moisture.
A high soil moisture reading indicates dryer soil; a lower soil moisture
reading means wetter soil. Soil
Moisture requires an optional Leaf & Soil Moisture/Temperature Station
or Soil Moisture Station and is only available for Wireless Vantage
Pro2 Stations
|